What is the demographic structure of Vietnam?
Demographic structure
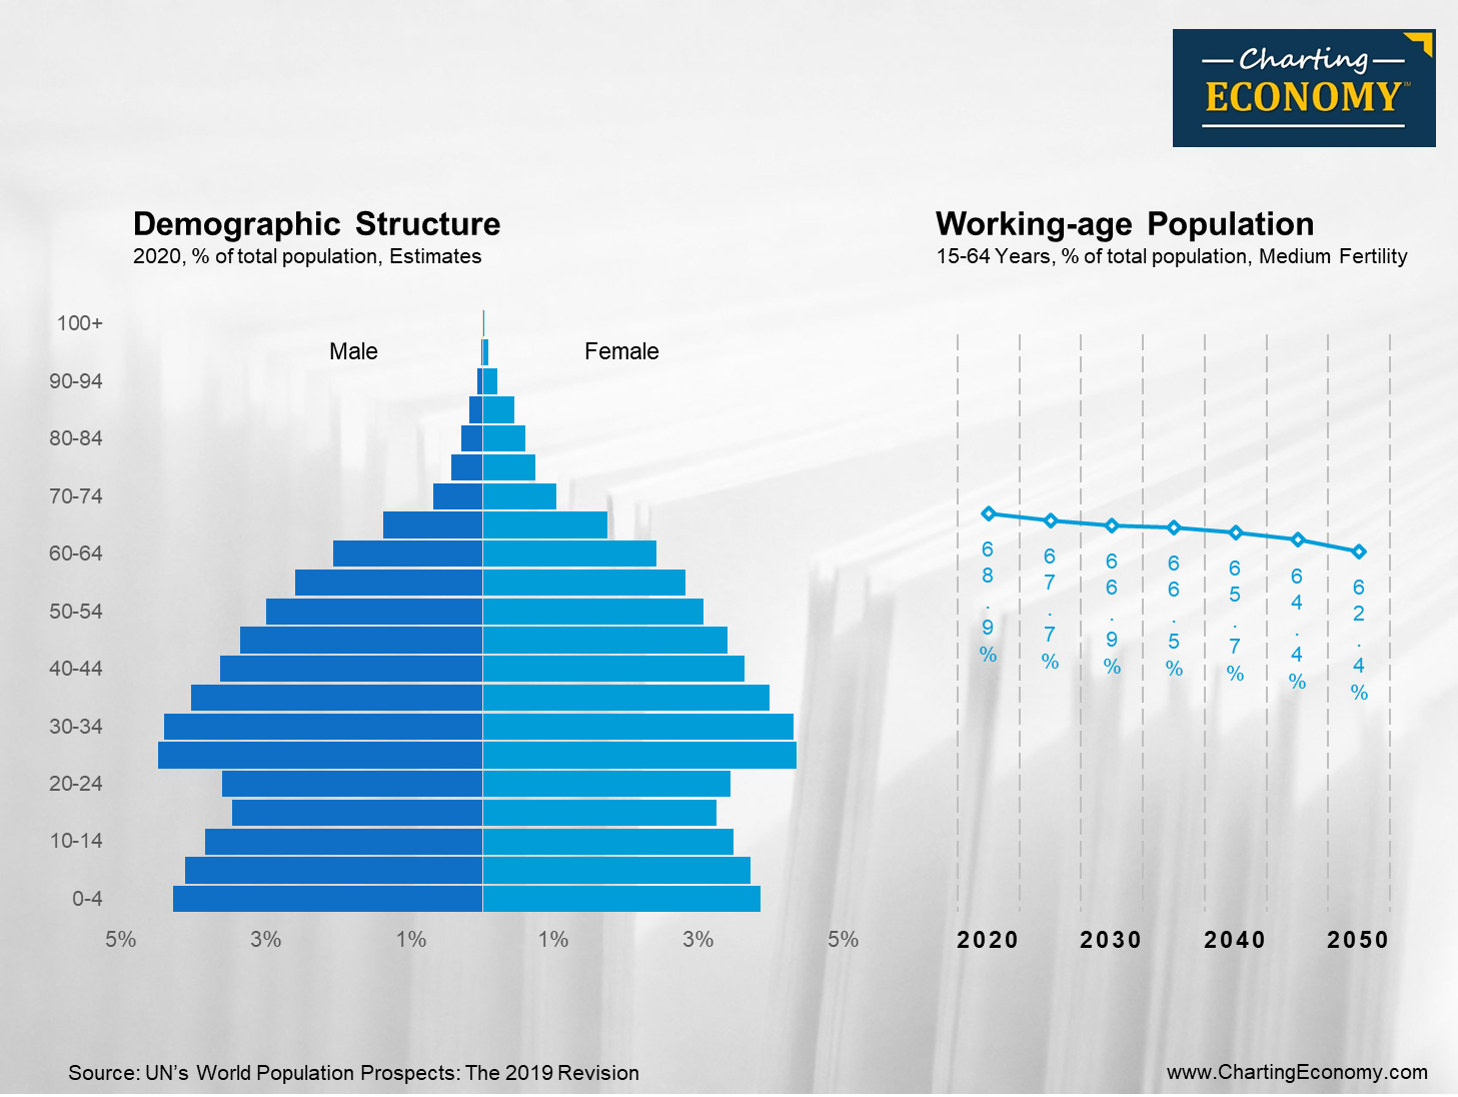
Total population (both sexes combined) by five-year age group.
Demographic projection
Projected by UN’s Population Division in World Population Prospects: 2019 Revision. There are many sets of assumptions in the projections, and we show here the medium fertility scenario as a base case.
Vietnam’s demographic structure
Vietnam’s favorable demographic structure is at its peak in terms of the working-age group. Going forward, the working-age group (15-64) will continue to decline from 68.9% to 62.4% of the total population over the next 30 years.
Related Questions
What is the size of Vietnam’s economy? See Chart
What is the size of Vietnam’s population? See Chart
How has the structure of Vietnam’s GDP changed over the years? See Chart
How much does Vietnam’s economy rely on external trade? See Chart
What are the key production sectors for Vietnam’s economy? See Chart
Economic Freedom Index: How free is Vietnam’s economy? See Chart

